Syllabus, videos, and student responses from the adoption of OpenIntro's Biostatistics text. The text …
Syllabus, videos, and student responses from the adoption of OpenIntro's Biostatistics text. The text has its own accompanying videos and a mostly self-grading homework platform.Instructor resources are available: https://www.openintro.org/teachers/. These resources accompany the open textbook Introductory Statistics for the Life and Biomedical Sciences.
This textbook is part of the OpenIntro Statistics series and offers complete …
This textbook is part of the OpenIntro Statistics series and offers complete coverage of the high school AP Statistics curriculum. Real data and plenty of inline examples and exercises make this an engaging and readable book. Links to lecture slides, video overviews, calculator tutorials, and video solutions to selected end of chapter exercises make this an ideal choice for any high school or Community College teacher. In fact, Portland Community College recently adopted this textbook for its Introductory Statistics course, and it estimates that this will save their students $250,000 per year. Find out more at: openintro.org/ahss
View our video tutorials here: openintro.org/casio openintro.org/TI
We hope readers will take away three ideas from this book in …
We hope readers will take away three ideas from this book in addition to forming a foundation of statistical thinking and methods.
(1) Statistics is an applied field with a wide range of practical applications. (2) You don't have to be a math guru to learn from real, interesting data. (3) Data are messy, and statistical tools are imperfect. But, when you understand the strengths and weaknesses of these tools, you can use them to learn about the real world. Textbook overview The chapters of this book are as follows:
1. Data collection. Data structures, variables, and basic data collection techniques. 2. Summarizing data. Data summaries and graphics. 3. Probability. The basic principles of probability. 4. Distributions of random variables. Introduction to key distributions, and how the normal model applies to the sample mean and sample proportion. 5. Foundation for inference. General ideas for statistical inference in the context of estimating the population proportion. 6. Inference for categorical data. Inference for proportions using the normal and chisquare distributions. 7. Inference for numerical data. Inference for one or two sample means using the t distribution, and comparisons of many means using ANOVA. 8. Introduction to linear regression. An introduction to regression with two variables. Instructions are also provided in several sections for using Casio and TI calculators.
This course is oriented toward US high school students. The course is …
This course is oriented toward US high school students. The course is divided into 10 units of study. The first five units build the foundation of concepts, vocabulary, knowledge, and skills for success in the remainder of the course. In the final five units, we will take the plunge into the domain of inferential statistics, where we make statistical decisions based on the data that we have collected.
This is a free textbook teaching introductory statistics for undergraduates in Psychology. …
This is a free textbook teaching introductory statistics for undergraduates in Psychology. This textbook is part of a larger OER course package for teaching undergraduate statistics in Psychology, including this textbook, a lab manual, and a course website. All of the materials are free and copiable, with source code maintained in Github repositories.
Table of Contents 1 Why Statistics? 2 Describing Data 3 Correlation 4 Probability, Sampling, and Estimation 5 Foundations for inference 6 t-Tests 7 ANOVA 8 Repeated Measures ANOVA 9 Factorial ANOVA 10 More On Factorial Designs 11 Simulating Data 12 Thinking about answering questions with data 13 GIFs
This is a "first course" in the sense that it presumes no …
This is a "first course" in the sense that it presumes no previous course in probability. The mathematical prerequisites are ordinary calculus and the elements of matrix algebra. A few standard series and integrals are used, and double integrals are evaluated as iterated integrals. The reader who can evaluate simple integrals can learn quickly from the examples how to deal with the iterated integrals used in the theory of expectation and conditional expectation. Appendix B provides a convenient compendium of mathematical facts used frequently in this work. And the symbolic toolbox, implementing MAPLE, may be used to evaluate integrals, if desired.
In addition to an introduction to the essential features of basic probability in terms of a precise mathematical model, the work describes and employs user defined MATLAB procedures and functions (which we refer to as m-programs, or simply programs) to solve many important problems in basic probability. This should make the work useful as a stand-alone exposition as well as a supplement to any of several current textbooks.
Most of the programs developed here were written in earlier versions of MATLAB, but have been revised slightly to make them quite compatible with MATLAB 7. In a few cases, alternate implementations are available in the Statistics Toolbox, but are implemented here directly from the basic MATLAB program, so that students need only that program (and the symbolic mathematics toolbox, if they desire its aid in evaluating integrals).
Since machine methods require precise formulation of problems in appropriate mathematical form, it is necessary to provide some supplementary analytical material, principally the so-called minterm analysis. This material is not only important for computational purposes, but is also useful in displaying some of the structure of the relationships among events.
Table of Contents 1 Preface 2 Probability Systems 3 Minterm Analysis 4 Conditional Probability 5 Independence of Events 6 Conditional Independence 7 Random Variables and Probabilities 8 Distribution and Density Functions 9 Random Vectors and joint Distributions 10 Independent Classes of Random Variables 11 Functions of Random Variables 12 Mathematical Expectation 13 Variance, Covariance, Linear Regression 14 Transform Methods 15 Conditional Expectation, Regression 16 Random Selection 17 Conditional Independence, Given a Random Vector 18 Appendices
I designed the course for graduate students who use statistics in their …
I designed the course for graduate students who use statistics in their research, plan to use statistics, or need to interpret statistical analyses performed by others. The primary audience are graduate students in the environmental sciences, but the course should benefit just about anyone who is in graduate school in the natural sciences. The course is not designed for those who want a simple overview of statistics; well learn by analyzing real data. This course or equivalent is required for UMB Biology and EEOS Ph.D. students. It is a recommended course for several of the intercampus graduate school of marine science program options.
The Art of the Probable" addresses the history of scientific ideas, in …
The Art of the Probable" addresses the history of scientific ideas, in particular the emergence and development of mathematical probability. But it is neither meant to be a history of the exact sciences per se nor an annex to, say, the Course 6 curriculum in probability and statistics. Rather, our objective is to focus on the formal, thematic, and rhetorical features that imaginative literature shares with texts in the history of probability. These shared issues include (but are not limited to): the attempt to quantify or otherwise explain the presence of chance, risk, and contingency in everyday life; the deduction of causes for phenomena that are knowable only in their effects; and, above all, the question of what it means to think and act rationally in an uncertain world. Our course therefore aims to broaden students’ appreciation for and understanding of how literature interacts with--both reflecting upon and contributing to--the scientific understanding of the world. We are just as centrally committed to encouraging students to regard imaginative literature as a unique contribution to knowledge in its own right, and to see literary works of art as objects that demand and richly repay close critical analysis. It is our hope that the course will serve students well if they elect to pursue further work in Literature or other discipline in SHASS, and also enrich or complement their understanding of probability and statistics in other scientific and engineering subjects they elect to take.
This course covers sensing and measurement for quantitative molecular/cell/tissue analysis, in terms …
This course covers sensing and measurement for quantitative molecular/cell/tissue analysis, in terms of genetic, biochemical, and biophysical properties. Methods include light and fluorescence microscopies; electro-mechanical probes such as atomic force microscopy, laser and magnetic traps, and MEMS devices; and the application of statistics, probability and noise analysis to experimental data.
Introductory survey of quantitative methods (QM), or the application of statistics in …
Introductory survey of quantitative methods (QM), or the application of statistics in the workplace. Examines techniques for gathering, analyzing, and interpreting data in any number of fieldsĺÎĺ from anthropology to hedge fund management.
Living in a big city like New York can be very challenging. …
Living in a big city like New York can be very challenging. City planning is an interdisciplinary enterprise where social scientists, humanists, psychologists, scientists, statisticians, citizens, politicians, etc. come together to offer solutions to improve quality of life in the city. To find such solutions, these people need clear and reliable (qualitative and quantitative) information about specific challenges that residents and visitors face For the variety of stakeholders in the city, many different things might be considered worthy of study, depending on their interests and needs regarding, e.g., employment, financial status, family size, healthcare, mobility, and education. For example, do you know whether your neighborhood issufficiently protected from a fire? What about other neighborhoods in the city? To what extent does a CUNY degree help a person gain employment in the City? In which ways do race or gender or sexual preference play a role in how people experience city life? Can these be quantified in dollar terms? Once you have identified a problem, write an essay that describes a question about city life that you believe is worthy of a statistical study.
Table of Contents 1 Sampling and Data 2 Descriptive Statistics 3 Probability …
Table of Contents
1 Sampling and Data 2 Descriptive Statistics 3 Probability Topics 4 Discrete Random Variables 5 Continuous Random Variables 6 The Normal Distribution 7 The Central Limit Theorem 8 Confidence Intervals 9 Hypothesis Testing: Single Mean and Single Proportion 10 Hypothesis Testing: Two Means, Paired Data, Two Proportions 11 The Chi-Square Distribution 12 Linear Regression and Correlation 13 F Distribution and ANOVA 14 Appendix 15 Tables
Collaborative Statistics was written by Barbara Illowsky and Susan Dean, faculty members at De Anza Collegein Cupertino, California. The textbook was developed over several years and has been used in regularand honors-level classroom settings and in distance learning classes. Courses using this textbook have beenarticulated by the University of California for transfer of credit. The textbook contains full materials forcourse offerings, including expository text, examples, labs, homework, and projects. A Teacher's Guide iscurrently available in print form and on the Connexions site at and supplemental course materials including additional problem sets and video lectures are available. The on-line text for each of these collections collections willmeet the Section 508 standards for accessibility.
An on-line course based on the textbook was also developed by Illowsky and Dean. It has won an awardas the best on-line California community college course. The on-line course will be available at a later dateas a collection in Connexions, and each lesson in the on-line course will be linked to the on-line textbookchapter. The on-line course will include, in addition to expository text and examples, videos of courselectures in captioned and non-captioned format.
This course covers the analytical, graphical, and numerical methods supporting the analysis …
This course covers the analytical, graphical, and numerical methods supporting the analysis and design of integrated biological systems. Topics include modularity and abstraction in biological systems, mathematical encoding of detailed physical problems, numerical methods for solving the dynamics of continuous and discrete chemical systems, statistics and probability in dynamic systems, applied local and global optimization, simple feedback and control analysis, statistics and probability in pattern recognition.
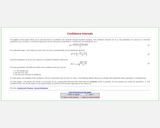
The applets in this section of Statistical Java allow you to see …
The applets in this section of Statistical Java allow you to see how levels of confidence are achieved through repeated sampling. The confidence intervals are related to the probability of successes in a Binomial experiment.
This open resources textbook contains 10 Units that describe and explain the …
This open resources textbook contains 10 Units that describe and explain the main concepts in statistical analysis of psychological data (managing data, measures of central tendency, measures of spread, correlations, simple linear regression). In addition to conceptual descriptions and explanations of the basic analyses for descriptive statistics, this textbook also explains how to conduct those analyses with common statistical software (Excel) and open-source free software (R). This book is directed to undergraduates studying basic statistics, especially basic statistics in psychological research.
This course covers the design, construction, and testing of field robotic systems, …
This course covers the design, construction, and testing of field robotic systems, through team projects with each student responsible for a specific subsystem. Projects focus on electronics, instrumentation, and machine elements. Design for operation in uncertain conditions is a focus point, with ocean waves and marine structures as a central theme. Topics include basic statistics, linear systems, Fourier transforms, random processes, spectra, ethics in engineering practice, and extreme events with applications in design.
This course is an introduction to data cleaning, analysis and visualization. We …
This course is an introduction to data cleaning, analysis and visualization. We will teach the basics of data analysis through concrete examples. You will learn how to take raw data, extract meaningful information, use statistical tools, and make visualizations. This was offered as a non-credit course during the Independent Activities Period (IAP), which is a special 4-week term at MIT that runs from the first week of January until the end of the month.
Ancillary materials for interactive statistics: 1: Random Number Generator 2: Completing a …
Ancillary materials for interactive statistics:
1: Random Number Generator 2: Completing a Frequency, Relative, and Cumulative Relative Frequency Table Activity 3: The Box Plot Creation Game 4: Online Calculator of the Mean and Median 5: Online Mean, Median, and Mode Calculator From a Frequency Table 6: Standard Deviation Calculator 7: Guess the Standard Deviation Game 8: Mean and Standard Deviation for Grouped Frequency Tables Calculator 9: Z-Score Calculator 10. Expected Value and Standard Deviation Calculator 11: Be the Player Or the Casino Expected Value Game 12: Binomial Distribution Calculator 13: Normal Probability Calculator 14: Calculator For the Sampling Distribution for Means 15: Discover the Central Limit Theorem Activity 16: Sampling Distribution Calculator for Sums 17: Observe the Relationship Between the Binomial and Normal Distributions 18: Confidence Interval Calculator for a Mean Calculator With Statistics (Sigma Unknown) 19: Visually Compare the Student's t Distribution to the Normal Distribution 20: Sample Size for a Mean Calculator 21: Confidence Interval for a Mean (With Data) Calculator 22: Interactively Observe the Effect of Changing the Confidence Level and the Sample Size 23: Confidence Interval for a Mean (With Statistics) Calculator 24: Confidence Interval Calculator for a Population Mean (With Data, Sigma Unknown) 25: Confidence Interval For Proportions Calculator 26: Needed Sample Size for a Confidence Interval for a Population Proportion Calculator 27: Hypothesis Test for a Population Mean Given Statistics Calculator 28: Hypothesis Test for a Population Mean With Data Calculator 29: Hypothesis Test for a Population Proportion Calculator 30: Two Independent Samples With Data Hypothesis Test and Confidence Interval Calculator 31: Two Independent Samples With Statistics and Known Population Standard Deviations Hypothesis Test and Confidence Interval Calculator 32: Two Independent Samples With Statistics Calculator 33: Hypothesis Test and Confidence Interval Calculator: Difference Between Population Proportions 34: Hypothesis Test and Confidence Interval Calculator for Two Dependent Samples 35: Visualize the Chi-Square Distribution 36: Chi-Square Goodness of Fit Test Calculator 37: Chi-Square Test For Independence Calculator 38: Chi-Square Test For Homogeneity Calculator 39: Scatter Plot Calculator 40: Scatter Plot, Regression Line, r,and r^2 Calculator 41: Full Regression Analysis Calculator 42: Shoot Down Money at the Correct Correlation Game 43: Visualize How Changing the Numerator and Denominator Degrees of Freedom Changes the Graph of the F-Distribution 44: ANOVA Calculator 45: Central Limit Theorem Activity
Introductory statistics courses prepare students to think statistically but cover relatively few …
Introductory statistics courses prepare students to think statistically but cover relatively few statistical methods. Building on the basic statistical thinking emphasized in an introductory course, a second course in statistics at the undergraduate level can explore a large number of statistical methods. This text covers more advanced graphical summaries, One-Way ANOVA with pair-wise comparisons, Two-Way ANOVA, Chi-square testing, and simple and multiple linear regression models. Models with interactions are discussed in the Two-Way ANOVA and multiple linear regression setting with categorical explanatory variables. Randomization-based inferences are used to introduce new parametric distributions and to enhance understanding of what evidence against the null hypothesis “looks like”. Throughout, the use of the statistical software R via Rstudio is emphasized with all useful code and data sets provided within the text. This is Version 3.0 of the book.
Table of Contents 1 Preface 2 (R)e-Introduction to statistics 3 One-Way ANOVA 4 Two-Way ANOVA 5 Chi-square tests 6 Correlation and Simple Linear Regression 7 Simple linear regression inference 8 Multiple linear regression 9 Case studies
No restrictions on your remixing, redistributing, or making derivative works. Give credit to the author, as required.
Your remixing, redistributing, or making derivatives works comes with some restrictions, including how it is shared.
Your redistributing comes with some restrictions. Do not remix or make derivative works.
Most restrictive license type. Prohibits most uses, sharing, and any changes.
Copyrighted materials, available under Fair Use and the TEACH Act for US-based educators, or other custom arrangements. Go to the resource provider to see their individual restrictions.