Updating search results...

Business Statistics

Introduction to quantitative analysis of business and economics, with emphasis on the application of statistical methods and tools in business decision-making. Topics include descriptive statistics, elementary probability, and introduction to statistical inference using sampling, estimation, and introduction to hypothesis testing; and use of application software. Additional topics include: two-sample confidence intervals and hypothesis testing, correlation analysis, anova, regression and forecasting; and use of application software.

13 affiliated resources

Search Resources

View
Selected filters:
Advanced Statistics
Unrestricted Use
CC BY
Rating
0.0 stars

This course is oriented toward US high school students. The course is divided into 10 units of study. The first five units build the foundation of concepts, vocabulary, knowledge, and skills for success in the remainder of the course. In the final five units, we will take the plunge into the domain of inferential statistics, where we make statistical decisions based on the data that we have collected.

Subject:
Mathematics
Statistics and Probability
Material Type:
Full Course
Provider:
The Saylor Foundation
Date Added:
04/04/2019
Business Statistics
Unrestricted Use
CC BY
Rating
0.0 stars

Introductory survey of quantitative methods (QM), or the application of statistics in the workplace. Examines techniques for gathering, analyzing, and interpreting data in any number of fieldsĺÎĺ from anthropology to hedge fund management.

Subject:
Business and Communication
Management
Mathematics
Statistics and Probability
Material Type:
Activity/Lab
Full Course
Homework/Assignment
Reading
Syllabus
Provider:
The Saylor Foundation
Provider Set:
Saylor Textbooks
Date Added:
09/07/2018
Confidence Intervals
Conditional Remix & Share Permitted
CC BY-NC-SA
Rating
0.0 stars

The applets in this section of Statistical Java allow you to see how levels of confidence are achieved through repeated sampling. The confidence intervals are related to the probability of successes in a Binomial experiment.

Subject:
Mathematics
Statistics and Probability
Material Type:
Activity/Lab
Provider:
Consortium for the Advancement of Undergraduate Statistics Education
Provider Set:
Causeweb.org
Author:
Anderson-Cook, C.
C.Anderson-Cook
Dorai-Raj, S.
Robinson, T.
S.Dorai-Raj
T.Robinson
Date Added:
04/04/2019
Data, Models, and Decisions, Fall 2014
Conditional Remix & Share Permitted
CC BY-NC-SA
Rating
0.0 stars

This course is designed to introduce first-year Sloan MBA students to the fundamental techniques of using data. In particular, the course focuses on various ways of modeling, or thinking structurally about decision problems in order to make informed management decisions.

Subject:
Business and Communication
Material Type:
Full Course
Provider:
M.I.T.
Provider Set:
M.I.T. OpenCourseWare
Author:
Freund, Robert
Rudin, Cynthia
Vielma, Juan Pablo
Date Added:
01/01/2014
How to Use Microsoft Excel: The Careers in Practice Series
Conditional Remix & Share Permitted
CC BY-NC-SA
Rating
0.0 stars

How to Use Microsoft Excel: The Careers in Practice Series is an textbook appropriate for a course covering Microsoft Excel at a beginner to intermediate level. It is geared toward and will be accommodating for students and instructors with little to no experience in using Microsoft Excel. However, the approach is not at the expense of relevance.

Subject:
Business and Communication
Material Type:
Textbook
Provider:
The Saylor Foundation
Provider Set:
Saylor Textbooks
Author:
Joseph Manzo
Date Added:
01/01/2012
Introductory Business Statistics
Unrestricted Use
CC BY
Rating
0.0 stars

Introductory Business Statistics is designed to meet the scope and sequence requirements of the one-semester statistics course for business, economics, and related majors. Core statistical concepts and skills have been augmented with practical business examples, scenarios, and exercises. The result is a meaningful understanding of the discipline, which will serve students in their business careers and real-world experiences.

Subject:
Business and Communication
Material Type:
Textbook
Author:
Barbara Illowsky
Lex Holmes
Susan Dean
Date Added:
12/04/2018
Introductory Business Statistics with Interactive Spreadsheets - 1st Canadian Edition
Unrestricted Use
CC BY
Rating
0.0 stars

"Introductory Business Statistics with Interactive Spreadsheets - 1st Canadian Edition" is an adaptation of Thomas K. Tiemann's book, "Introductory Business Statistics". In addition to covering basics such as populations, samples, the difference between data and information, and sampling distributions, descriptive statistics and frequency distributions, normal and t-distributions, hypothesis testing, t-tests, f-tests, analysis of variance, non-parametric tests, and regression basics, the following information has been added: the chi-square test and categorical variables, null and alternative hypotheses for the test of independence, simple linear regression model, least squares method, coefficient of determination, confidence interval for the average of the dependent variable, and prediction interval for a specific value of the dependent variable. This new edition also allows readers to learn the basic and most commonly applied statistical techniques in business in an interactive way -- when using the web version -- through interactive Excel spreadsheets. All information has been revised to reflect Canadian content.

Subject:
Business and Communication
Mathematics
Statistics and Probability
Material Type:
Textbook
Provider:
BCcampus
Provider Set:
BCcampus Open Textbooks
Author:
Mohammad Mahbobi, Thompson Rivers University; Thomas K. Tiemann, Elon University
Date Added:
04/19/2016
Introductory Statistics
Unrestricted Use
CC BY
Rating
0.0 stars

Introductory Statistics follows scope and sequence requirements of a one-semester introduction to statistics course and is geared toward students majoring in fields other than math or engineering. The text assumes some knowledge of intermediate algebra and focuses on statistics application over theory. Introductory Statistics includes innovative practical applications that make the text relevant and accessible, as well as collaborative exercises, technology integration problems, and statistics labs.

Access also available here: https://openstax.org/details/books/introductory-statistics

Table of Contents
Sampling and Data
Descriptive Statistics
Probability Topics
Discrete Random Variables
Continuous Random Variables
The Normal Distribution
The Central Limit Theorem
Confidence Intervals
Hypothesis Testing with One Sample
Hypothesis Testing with Two Samples
The Chi-Square Distribution
Linear Regression and Correlation
F Distribution and One-Way ANOVA

Subject:
Mathematics
Statistics and Probability
Material Type:
Textbook
Provider:
Rice University
Provider Set:
OpenStax College
Author:
Barbara Ilowsky
Susan Dean
Date Added:
07/19/2013
Principles of Business Statistics
Unrestricted Use
CC BY
Rating
0.0 stars

You are probably asking yourself the question, "When and where will I use statistics?". If you read any newspaper or watch television, or use the Internet, you will see statistical information. There are statistics about crime, sports, education, politics, and real estate. Typically, when you read a newspaper article or watch a news program on television, you are given sample information. With this information, you may make a decision about the correctness of a statement, claim, or "fact." Statistical methods can help you make the "best educated guess."
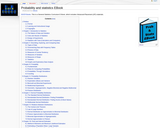
Table of Contents
1 Sampling and Data

1.1 Sampling and Data: Introduction
1.2 Sampling and Data: Statistics
1.3 Sampling and Data: Key Terms
1.4 Sampling and Data: Data
1.5 Sampling and Data: Variation and Critical Evaluation
1.6 Sampling and Data: Frequency, Relative Frequency, and Cumulative Frequency
2 Descriptive Statistics

2.1 Descriptive Statistics: Introduction
2.2 Descriptive Statistics: Displaying Data
2.3 Descriptive Statistics: Histogram
2.4 Descriptive Statistics: Measuring the Center of the Data
2.5 Descriptive Statistics: Skewness and the Mean, Median, and Mode
2.6 Descriptive Statistics: Measuring the Spread of the Data
3 The Normal Distribution

3.1 Normal Distribution: Introduction
3.2 Normal Distribution: Standard Normal Distribution
3.3 Normal Distribution: Z-scores
3.4 Normal Distribution: Areas to the Left and Right of x
3.5 Normal Distribution: Calculations of Probabilities
3.6 Central Limit Theorem: Central Limit Theorem for Sample Means
3.7 Central Limit Theorem: Using the Central Limit Theorem
4 Confidence Interval

4.1 Confidence Intervals: Introduction
4.2 Confidence Intervals: Confidence Interval, Single Population Mean, Population Standard Deviation Known, Normal
4.3 Confidence Intervals: Confidence Interval, Single Population Mean, Standard Deviation Unknown, Student's-t
4.4 Confidence Intervals: Confidence Interval for a Population Proportion
5 Hypothesis Testing

5.1 Hypothesis Testing of Single Mean and Single Proportion: Introduction
5.2 Hypothesis Testing of Single Mean and Single Proportion: Null and Alternate Hypotheses
5.3 Hypothesis Testing of Single Mean and Single Proportion: Using the Sample to Test the Null Hypothesis
5.4 Hypothesis Testing of Single Mean and Single Proportion: Decision and Conclusion
6 Linear Regression and Correlation

6.1 Linear Regression and Correlation: Introduction
6.2 Linear Regression and Correlation: Linear Equations
6.3 Linear Regression and Correlation: Slope and Y-Intercept of a Linear Equation
6.4 Linear Regression and Correlation: Scatter Plots
6.5 Linear Regression and Correlation: The Regression Equation
6.6 Linear Regression and Correlation: Correlation Coefficient and Coefficient of Determination
6.7 Linear Regression and Correlation: Testing the Significance of the Correlation Coefficient
6.8 Linear Regression and Correlation: Prediction

Subject:
Mathematics
Statistics and Probability
Material Type:
Textbook
Author:
Mihai Nica
Date Added:
06/25/2020
Probability and Statistics EBook
Read the Fine Print
Educational Use
Rating
0.0 stars

This is an Internet-based probability and statistics E-Book. The materials, tools and demonstrations presented in this E-Book would be very useful for advanced-placement (AP) statistics educational curriculum. The E-Book is initially developed by the UCLA Statistics Online Computational Resource (SOCR). However, all statistics instructors, researchers and educators are encouraged to contribute to this project and improve the content of these learning materials.
There are 4 novel features of this specific Statistics EBook. It is community-built, completely open-access (in terms of use and contributions), blends information technology, scientific techniques and modern pedagogical concepts, and is multilingual.

Subject:
Mathematics
Statistics and Probability
Material Type:
Textbook
Provider:
UCLA
Provider Set:
Statistics Online Computational Resource
Author:
Statistics Online Computational Resource
Date Added:
01/01/2007
Spreadsheets
Unrestricted Use
CC BY
Rating
0.0 stars

This course will provide you with a comprehensive introduction to spreadsheets; it is designed for first-time users with very little or no exposure to the subject.

Subject:
Business and Communication
Material Type:
Activity/Lab
Full Course
Homework/Assignment
Reading
Syllabus
Provider:
The Saylor Foundation
Provider Set:
Saylor Academy Professional Development
Date Added:
09/07/2018
Statistics: T-Statistic Confidence Interval
Conditional Remix & Share Permitted
CC BY-NC-SA
Rating
0.0 stars

This 12-minute video lesson looks at the T-Statistic Confidence Interval (for small sample sizes). [Statistics playlist: Lesson 52 of 85]

Subject:
Mathematics
Statistics and Probability
Material Type:
Lecture
Provider:
Khan Academy
Provider Set:
Khan Academy
Author:
Salman Khan
Date Added:
02/20/2011