Calculating Price Elasticity of Demand
Let’s calculate the elasticity between points A and B and between points G and H as Figure shows.
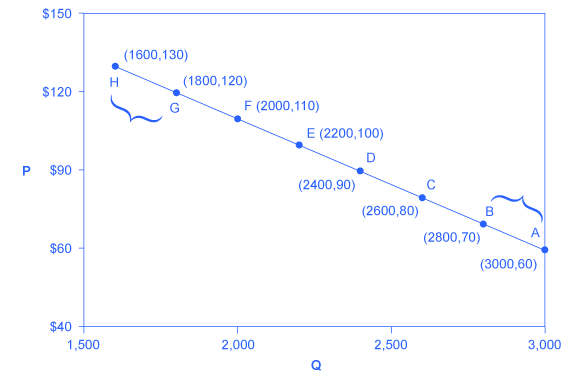
First, apply the formula to calculate the elasticity as price decreases from $70 at point B to $60 at point A:
Therefore, the elasticity of demand between these two points is which is 0.45, an amount smaller than one, showing that the demand is inelastic in this interval. Price elasticities of demand are always negative since price and quantity demanded always move in opposite directions (on the demand curve). By convention, we always talk about elasticities as positive numbers. Mathematically, we take the absolute value of the result. We will ignore this detail from now on, while remembering to interpret elasticities as positive numbers.
This means that, along the demand curve between point B and A, if the price changes by 1%, the quantity demanded will change by 0.45%. A change in the price will result in a smaller percentage change in the quantity demanded. For example, a 10% increase in the price will result in only a 4.5% decrease in quantity demanded. A 10% decrease in the price will result in only a 4.5% increase in the quantity demanded. Price elasticities of demand are negative numbers indicating that the demand curve is downward sloping, but we read them as absolute values. The following Work It Out feature will walk you through calculating the price elasticity of demand.
Finding the Price Elasticity of Demand
Calculate the price elasticity of demand using the data in Figure for an increase in price from G to H. Has the elasticity increased or decreased?
Step 1. We know that:
Step 2. From the Midpoint Formula we know that:
Step 3. So we can use the values provided in the figure in each equation:
Step 4. Then, we can use those values to determine the price elasticity of demand:
Therefore, the elasticity of demand from G to is H 1.47. The magnitude of the elasticity has increased (in absolute value) as we moved up along the demand curve from points A to B. Recall that the elasticity between these two points was 0.45. Demand was inelastic between points A and B and elastic between points G and H. This shows us that price elasticity of demand changes at different points along a straight-line demand curve.